Performance Dashboard
Last updated
Last updated
You can understand the performance of each app version in real time using the IMQA MPM Performance Dashboard. You can check the app summary and the main performance status as time series data, and check the overall performance of the screens visited by the user.
The Dashboard page consists of the following:
❶ Top bar (common) ❷ Toolbar (Performance Dashboard) ❸ App summary ❹ Performance Issue rate ❺ Time series performance information ❻ Screen performance ❼ Poor performance list ❽ Recent alert list
❶ Logo Click this logo to go to the main page of the project list.
❷ MPM menu Click this menu to go to each MPM menu page.
❸ Mode change icon You can change the theme in the “Dashboard” and “UBA (User Behavior Analysis)" page. Click this icon to change the theme to “light mode” or “dark mode”.
❹ Crash icon This icon is displayed when the Crash service is created while creating a project. Click this icon to go to “Crash > Dashboard” of the same app.
❺ Project navigation You can move from the current project to another project. Click the [Home] icon to go to the project list. When the project is changed, you will be moved to “Service > Dashboard” of the app in question.
❻ Member menu The member menu of the logged-in account is displayed.
Installation guide: You can read the IMQA installation guide. A new browser tab is displayed when clicked.
Settings: You can change the user name and the password. You can also change the display reference time of IMQA analysis information with browser timezone.
If the logged-in user is in an environment where the time zone information cannot be automatically obtained, IMQA time information may not be displayed properly. You can manually set the browser timezone according to the GMT time zone of the connected area.
Language setting: You can change the display language of IMQA. You can select from Korean or English.
Logout: You can log out from your account.
❶ Dashboard information Displays the current Dashboard View mode.
❷ Project information Displays the project’s platform icon and project name.
❸ App version You can change the project’s app version. If you change the app version, the dashboard information will be updated to the selected app version.
You can designate the main app version to monitor in IMQA according to the app’s management cycle. For details of app versions management, please refer to “Using Crash > All project management > App Version Management“.
❹ Dashboard view You can change to a Dashboard View that shows different subjects.
You can check the number of users and app launches of a specific app version for the past 24 hours.
You can check the number of users and app launches for the past 24 hours.
Daily User: Counts the number of users for the past 24 hours. The count refers to the number of users alone, excluding duplicates.
Daily Run Count: Counts the number of app launches for the past 24 hours.
Daily User
Today's date 00:00 ~ Current time
Number of users
Counting
Daily Run Count
Today's date 00:00 ~ Current time
Number of app launches
Counting
One thousand is represented as “1K” for quick understanding. To view actual data, hover the mouse over “K” and the actual number will be displayed on a tooltip.
You can check the Avg Issue Rate in the past 30 minutes and Performance Weather indexes.
Avg Issue Rate: Calculates the average problem occurrence rate in which the data rate exceeds the threshold value of each performance index (UI Rendering Time, Response Time, CPU, Memory, and crash) for the past 30 minutes.
Performance Weather: Displays five-level weather icons depending on the Avg Issue Rate for the past 30 minutes.
Avg Issue Rate
Recent 30 minutes
Issue Rate
Issue Rate of each performance indexes
(Data above threshold / All data) * 100
Performance Weather
Recent 30 minutes
Avg Issue Rate
~20%, Step 5
The Avg Issue Rate and Performance Weather are useful in identifying the app-based performance for the past 30 minutes. The performance is quickly evaluated through the top evaluation index for each app.
Displays the problem occurrence rate of five performance indexes for the past 30 minutes on a graph, including crash, memory usage, CPU, response time, and UI rendering time. It displays the ratio of the data that exceeds the threshold of each performance index. You can compare the current app version with the previous app version. Comprehensive status is updated every minute.
Issue Rate: Calculates the problem occurrence rate by performance index for the past 30 minutes.
Crash
Recent 30 minutes
Issue Rate
mber of occurred crashes
/app launches
Memory
Recent 30 minutes
Issue Rate
(Data above threshold / All data) * 100
CPU
Recent 30 minutes
Issue Rate
(Data above threshold / All data) * 100
Response Time
Recent 30 minutes
Issue Rate
(Data above threshold / All data) * 100
UI Rendering Time
Recent 30 minutes
Issue Rate
(Data above threshold / All data) * 100
You can set the threshold by performance index at “Management > Project Preset”.
Displays the number of occurred crashes, the average of the bottom 5% and the total average of the performance indexes (UI rendering time, response time, CPU, and memory usage) for the past 30 minutes on a time-series graph. You can check the point of performance degradation and trends of performance changes. Time series performance information is updated every minute.
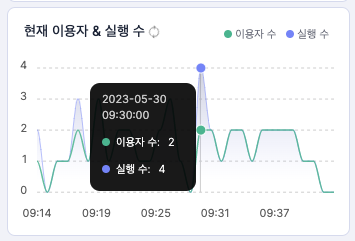
You can check and compare the user count and app launches for the past 30 minutes in one-minute interval. ‘Current users & Runs’ is updated every minute.
Current user: Counts the current user that occurred for the past 30 minutes in one-minute intervals. The count refers to the number of users alone, excluding duplicates.
Run count: Counts the app run count that occurred for the past 30 minutes in one-minute intervals.
You can check the number of occurred crashes for the past 30 minutes in a one-minute interval. Crash information is updated every minute.
Crash: Counts the number of crashes that occurred for the past 30 minutes in one-minute intervals.
You can check the UI rendering time for the past 30 minutes in a one-minute interval. Displays the total average and the average of bottom 5%, and the UI rendering time is updated every minute. (For React Native, you can check the screen/component loading time.)
Bottom 5%: Calculates the UI rendering time of bottom 5% on average for the past 30 minutes.
Average: Calculates the total UI rendering time on average for the past 30 minutes.
Bottom 5%
Recent 30 minutes
UI rendering time
Average of the bottom 5%
ms
Average
Recent 30 minutes
UI rendering time
Total average
ms
The horizontal line displayed in the graph indicates the performance threshold, which enables you to easily check the time and value when the performance issue above the threshold has occurred.
The Y-axis indicates the UI rendering time. Bottom 5% is calculated by sorting all data collected by IMQA in the order of the longest UI rendering time, which enables you to compare the average rendering time with that of some users. If the difference between bottom 5% and average is small, we can see that most users experience similar app usability.
You can check the response time for the past 30 minutes in a one-minute interval. Displays the total average and the average of bottom 5%, and the response time is updated every minute.
Bottom 5%: Calculates the response time of bottom 5% on average for the past 30 minutes.
Average: Calculates the total response time on average for the past 30 minutes.
Bottom 5%
Recent 30 minutes
Response time
Average of the bottom 5%
ms
Average
Recent 30 minutes
Response time
Total average
ms
The horizontal line displayed in the graph indicates the performance threshold, which enables you to easily check the time and value when the performance issue above the threshold has occurred.
Bottom 5% is calculated by sorting all data collected by IMQA in the order of the longest response time, which enables you to compare the time to respond to user requests on average with some performance degradation situations. If the response takes long, we can check whether there were any network or server problems at a specific time, and analyze in which environment the user experienced performance degradation in connection with “Comprehensive Status”.
You can check the CPU usage for the past 30 minutes in one-minute intervals. Displays the total average and the average of bottom 5%, and the CPU is updated every minute.
Bottom 5%: Calculates the CPU usage of bottom 5% on average for the past 30 minutes.
Average: Calculates the total CPU usage on average for the past 30 minutes.
Bottom 5%
Recent 30 minutes
CPU usage
Average of the bottom 5%
%
Average
Recent 30 minutes
CPU usage
Total average
%
The horizontal line displayed in the graph indicates the performance threshold, which enables you to easily check the time and value when the performance issue above the threshold has occurred.
Bottom 5% is calculated by sorting all data collected by IMQA in the order of the highest CPU usage, which enables you to compare the average CPU usage while the app is running with some performance degradation situations. On average, the threshold of app CPU usage is less than 50%. If it exceeds 50%, we can see that the app performs many tasks that use the CPU.
You can check the memory usage for the past 30 minutes in a one-minute interval. Displays the total average and the average of bottom 5%, and the memory usage is updated every minute.
Bottom 5%: Calculates the memory usage of bottom 5% on average for the past 30 minutes.
Average: Calculates the total memory usage on average for the past 30 minutes.
Bottom 5%
Recent 30 minutes
Memory usage
Average of the bottom 5%
MB
Average
Recent 30 minutes
Memory usage
Total average
MB
The horizontal line displayed in the graph indicates the performance threshold, which enables you to easily check the time and value when the performance issue above the threshold has occurred.
Bottom 5% is calculated by sorting all data collected by IMQA in the order of the highest memory usage, which enables you to compare the average memory usage while the app is running with some performance degradation situations. On average, the threshold of app memory usage is less than 100MB. If it exceeds 100MB, we can see that the app performs many tasks that use the memory.
You can check the performance status by the screen visited by the user for the past 30 minutes. You can monitor the user visit rate by screen, problem occurrence rate of each performance item, and the bottom 5% and the average. Screen performance is updated every minute.
The Screen performance consists of the following:
❶ Performance index You can change the performance index to “UI rendering time”, “Response Time”, “CPU”, or “memory usage”. If you change the index, the bottom 5% and the average displayed on the screen cards below are updated.
❷ Screen Card Sorting Defaults to “By Visit Rate”; Cards can be sorted “By Visit Rate,” “By Issue Rate,” “By Bottom 5%,” or “By Average” in descending order (highest to lowest).
❸ Screen type filter By default, the filter is set to “Total”. Filters are displayed that can be selected according to the app type selected at the time of project creation. For the WebView/hybrid app, screen cards can be filtered by “Native” and “WebView”.
❹ Total screen analysis table You can quickly check the performance status of each screen visited by users for the past 30 minutes in summary.
➎ Screen cards You can check the visit rate by screen visited by users for the past 30 minutes, the problem occurrence rate, the bottom 5%, and the average values.
For React Native, CPU and memory performance metrics are displayed centered on native data. The component screen card display function in the response time performance indicator will be updated in the future.
You can quickly check the problem occurrence rate of each screen visited by users for the past 30 minutes. A pop-up window is displayed if the [Total Screen Analysis Table] on the right is clicked.
The screen is sorted in the order of the highest visit rate, and displays the ratio of the data that exceeds the threshold set in “Manage > Project Preset” as a problem occurrence rate. The danger level is indicated in colors depending on the problem occurrence rate.
Based on this, you can check the performance degradation on the screen with a high visit rate at a glance. In addition, you can analyze performance degradation factors, such as whether the app users experienced problems in rendering on average, and whether the response to requests was slow.
You can check the visit rate by screen visited by users for the past 30 minutes, the problem occurrence rate, the bottom 5%, and the average values. The screen is sorted in the order of the highest visit rate. When you click on the screen card, the “Screen Performance Analysis” page will be displayed.
❶ Screen information Displays information such as screen type and path. Native screens display the ‘Native’ tag, and web view screens display information about the native screen that called the web view.
❷ Screen name Displays the name of the screen. If the screen name is too long, hover the mouse over the name to display the full name as a tooltip. You can change the screen name in such a way that it can be easily understood in IMQA by selecting “Manage > Screen Name”.
❸ Problem occurrence rate / Rate of visit / Performance information Displays the problem occurrence rate of the user who visited a specific screen for the past 30 minutes. The rate is displayed in color according to the rate. Displays the bottom 5% and the average value based on the rate of visits to a specific screen for the past 30 minutes and the performance standards.
Based on this, you can check the performance degradation on the screen with a high visit rate at a glance. In addition, you can also compare the average performance of app users with the performance of some users. You can analyze the cause of the performance degradation in detail by referring to “Performance analysis by screen” of the screen where the problem was detected.
React Native’s performance analysis function for each component will be updated in the future.
For IMQA settings for each component, refer to ‘React Native Library’.
Displays top 6 crashes that have occurred most frequently for the past 30 minutes. Crashes are sorted in the order of the highest crash count. If the crash name is too long, hover the mouse over the name to display the full name as a tooltip. Top Crash List is updated every minute.
Crash: Displays the name of the errors.
Number: Cumulatively counts the number of errors in question for 30 minutes.
Ratio: Displays the percentage of errors in question among the errors that occurred for 30 minutes.
Displays top 6 URLs with the slowest response for the past 30 minutes. Crashes are sorted in the order of the fastest response time. If the URL is too long, hover the mouse over the name to display the full name as a tooltip. The Top Response Time List is updated every minute.
URL: Displays the requested URL.
Number of calls: Cumulatively counts the number of requests for the URL in question for 30 minutes.
Response time: Displays the response time of the URL in question.
Displays the alert for the problem that exceeded the threshold for the past 30 minutes. You can set an alert in “Alert > Alert Policy”. Alerts are sorted in the order of the most recent alert. The alert is displayed as “The 'performance index' value in the [policy name] is at 'level of danger'”. The Recent Alert List is updated every minute.